Crux Supply Chain & ESG Whitepaper
Learn what Cannon Valley Research is all about directly from Jo Janssens in conversation with Crux Informatics CEO, Philip Brittan.“Crux offers data...

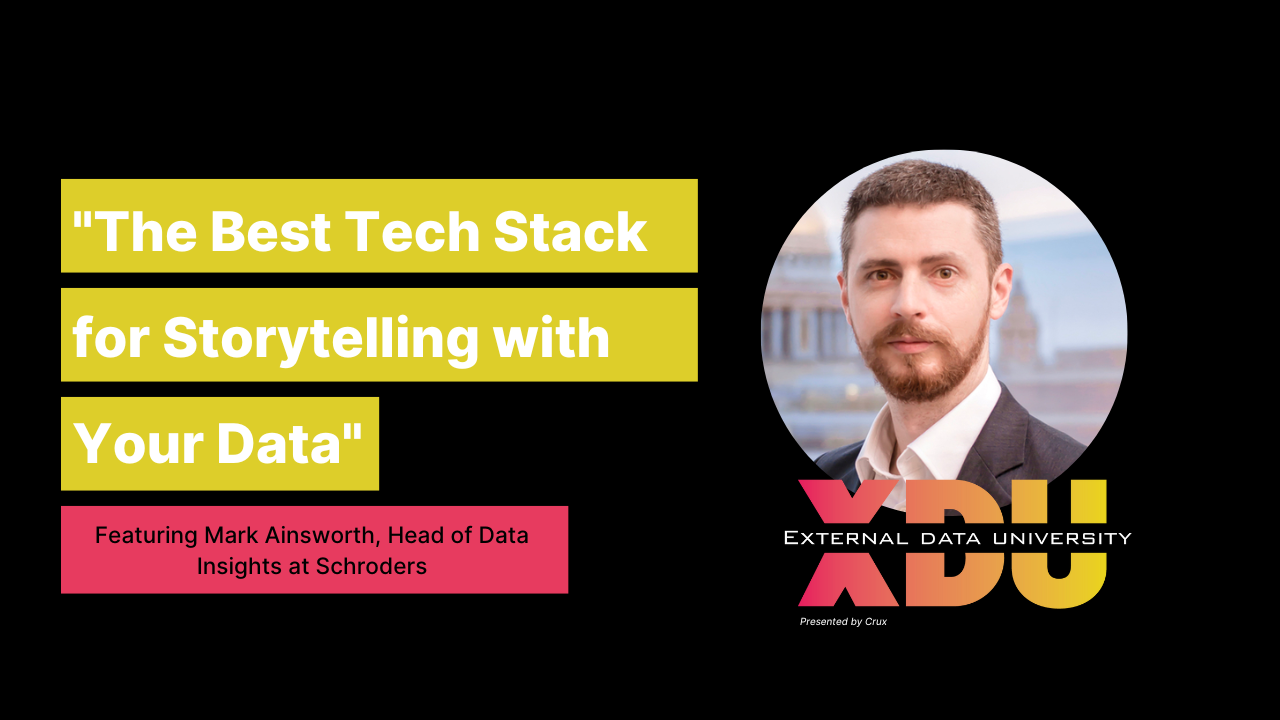
An interview with Mark Ainsworth, Head of Data Insights at Schroders.
Mark Ainsworth, the Head of Data Insights at Schroders, sat down with the Crux XDU team to share his career in the history of data firsts and how it fueled his love of maps. And while the maps are a great and fascinating visual, Mark also shared his opinions on the necessities of his preferred tech stack for storytelling with data, and now we’d like to share that with you.
But first, we’re working backward from the goal of the tech stack. As Mark states, “And I think I have to say, another really important part is if the heart of what you're trying to do is telling a story about the insights from data. That's often a key, final mile.” Taking the time to manually take screenshots and paste them into a presentation really allows a person to hone in on what they’re trying to communicate.
Mark continues, “It lets you really focus on that storytelling part of it. So that's, weirdly enough, the fact that this can totally not be integrated actually works. It lets you put yourself in a different mindset of telling the story, delivering the insight.”
And that’s what his tech stack is focused around–giving him the ability to tell a story with data the way he wants to communicate it. He has two main parts of a tech stack he looks for:
Sound too simple? It becomes a bigger decision when you consider the number of data stores and analytics tools on the market today. Mark prefers R to Python for his analytics work. He shared, “I'd say most people use Python, but it's very clear when the heart of what you're doing is about statistics, that sort of fitting a Bayesian model or that kind of thing.”
“R is just a much more natural fit to that. If the core thing is about writing code, like, you know, goes into production, Python's a much better fit. But if your heart of what you're doing is stats, R is a better fit.”
For more tips and insights on telling stories with data, you can check out Mark’s full interview on our External Data University YouTube channel here.
You can find additional expert interviews there as well, and recordings of previous XDU sessions, too. Have an idea for an expert interview or interactive session? Email scout.scholes@cruxdata.com with your thoughts.

Learn what Cannon Valley Research is all about directly from Jo Janssens in conversation with Crux Informatics CEO, Philip Brittan.“Crux offers data...

Supplier Spotlights highlight Crux's partners and shine a light on their unique data product offerings.

Supplier Spotlights highlight Crux's partners and shine a light on their unique data product offerings.